Project Overview
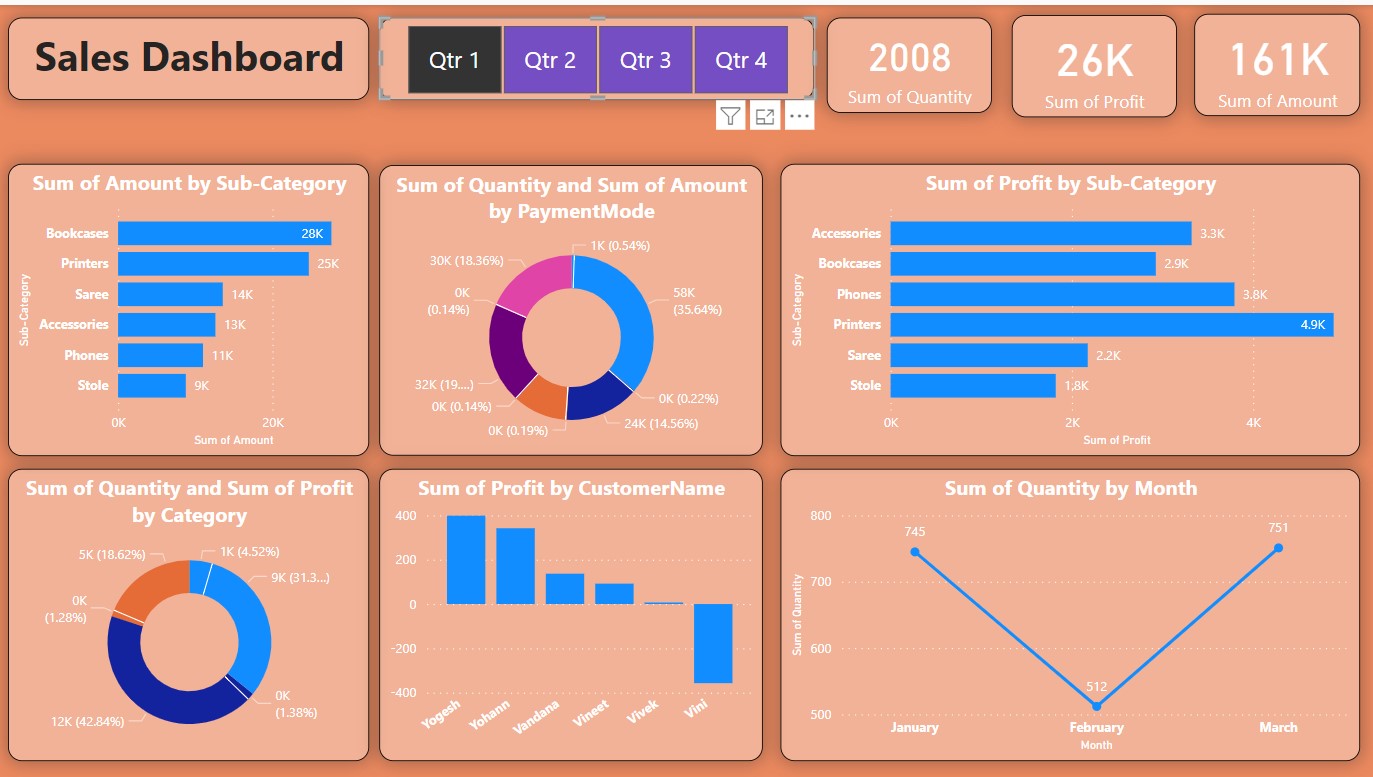
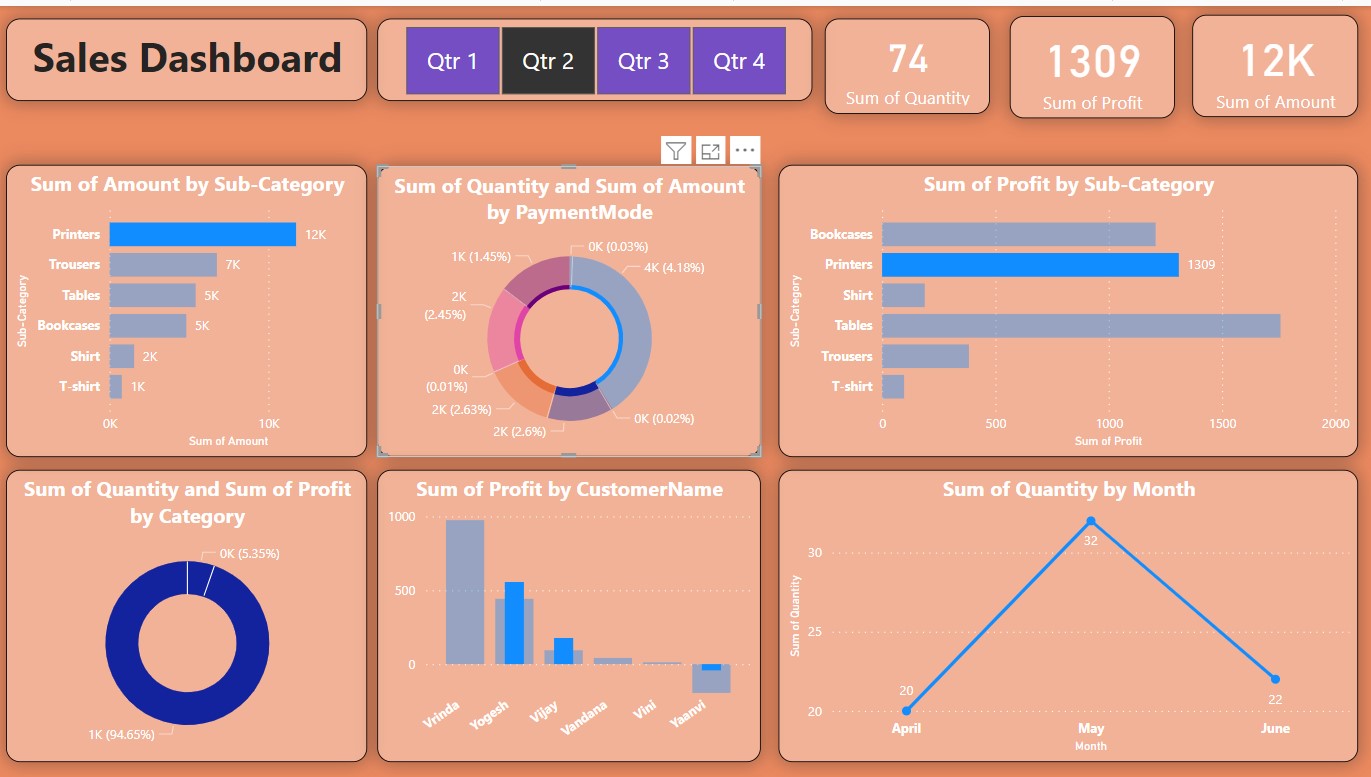
This project involves the development of a dynamic and interactive Sales Dashboard using Power BI, aimed at helping businesses analyze their sales performance more effectively. The dashboard is designed to provide key insights through visually appealing charts, graphs, and filters, enabling users to explore historical sales data and make data-driven decisions.
The main functionalities of the dashboard include:
Interactive Filters: Allows users to view and filter sales data by various parameters like region, time period, and product categories.
Sales Trend Analysis: Visualizes monthly, quarterly, and yearly sales trends to identify patterns, peak periods, and potential areas of improvement.
Key Performance Indicators (KPIs): Highlights critical metrics such as total sales, revenue growth, and customer acquisition.
Data Transformation: Raw sales data was cleaned and prepared for accurate visualization and analysis using Power BI’s powerful data transformation tools.
Actionable Insights: The dashboard provides insights into top-performing products, regions, and sales teams, helping businesses optimize their strategies for growth.
Technologies Used
- Power BI
- Data Cleaning and Preparation
- Data Visualization
- Sales Performance Analysis