Project Overview
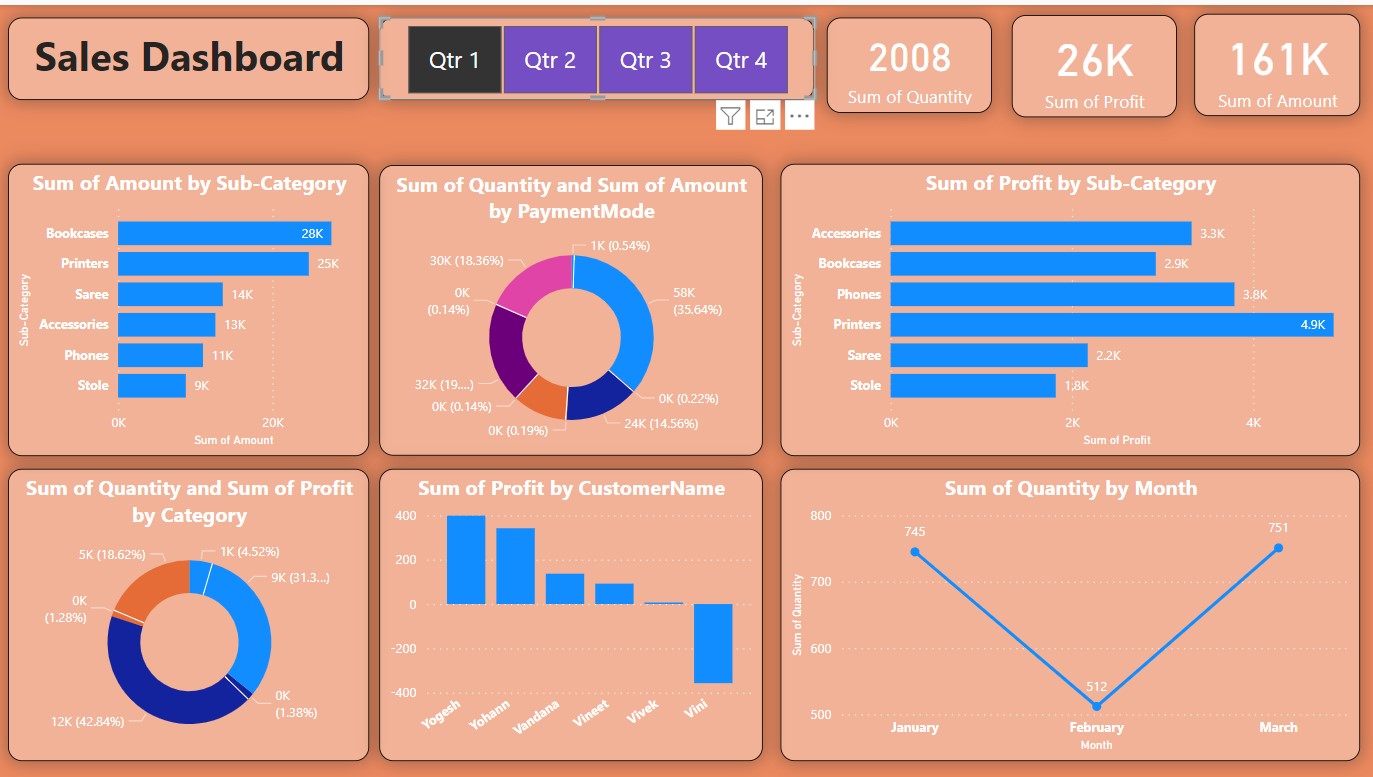
The Sales Report Dashboard is a comprehensive data visualization tool designed to help businesses track their sales performance metrics in real-time. This interactive dashboard provides a centralized platform for monitoring key performance indicators (KPIs) such as revenue, profit margins, product performance, regional sales, and customer demographics.
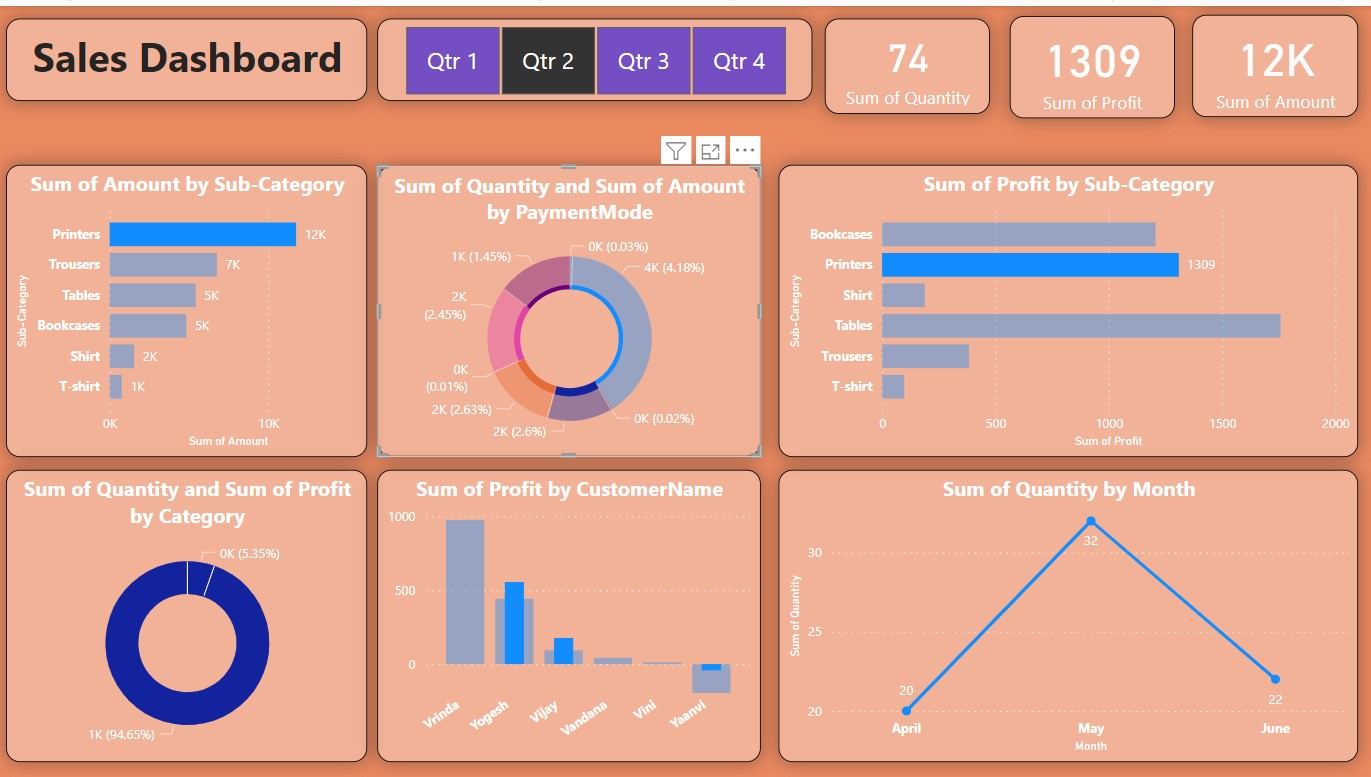
The dashboard features multiple visualization types including bar charts, line graphs, pie charts, and geographical maps to represent complex sales data in an easily digestible format. Users can filter data by date ranges, product categories, sales channels, and customer segments to gain deeper insights into specific areas of interest.
Real-time data processing capabilities allow for immediate visibility into sales trends, enabling quick identification of opportunities and challenges. The responsive design ensures that the dashboard is accessible on various devices, from desktop computers to tablets and smartphones.
View Live Demo